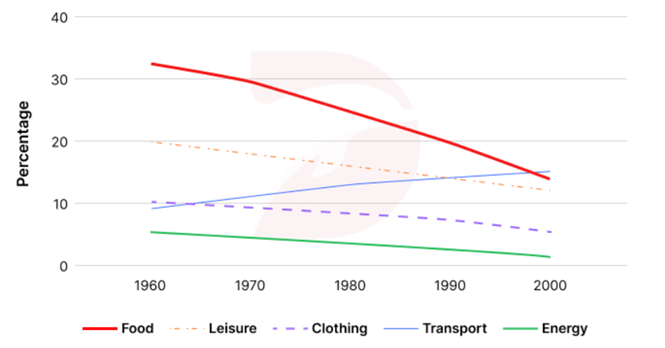
The line graph shows the percentage of spending in a European country from 1960 to 2000. Summarize the information by selecting and reporting the main features and make comparisons where rele
15/26
The line graph shows the percentage of spending in a European country from 1960 to 2000. Summarize the information by selecting and reporting the main features and make comparisons where relevant.
Hướng dẫn giải:
Gợi ý 1:
The line graph illustrates changes in the percentage of spending on five categories—food, leisure, clothing, transport, and energy—in a European country between 1960 and 2000. Overall, spending on food, leisure, clothing, and energy declined, while transport was the only category that saw an increase.
In 1960, food accounted for the largest share of expenditure, at just over 30%. However, this figure fell steadily over the next four decades, reaching around 15% by 2000. Leisure also experienced a gradual decline, dropping from 20% to just above 15%. Similarly, spending on clothing decreased slightly from 10% to below that level, and energy fell from about 6% to roughly 3%.
In contrast, transport showed an upward trend. Starting at around 10% in 1960, it rose consistently throughout the period, overtaking leisure and food by 2000 at approximately 15%.
In summary, while most categories saw a reduction in spending, transport became increasingly significant, suggesting a shift in priorities toward mobility and travel over time.
(Biểu đồ đường minh họa sự thay đổi tỷ lệ chi tiêu cho năm hạng mục—thực phẩm, giải trí, quần áo, giao thông và năng lượng—ở một quốc gia châu Âu từ năm 1960 đến 2000. Nhìn chung, chi tiêu cho thực phẩm, giải trí, quần áo và năng lượng đều giảm, trong khi giao thông là hạng mục duy nhất tăng lên.
Năm 1960, thực phẩm chiếm tỷ lệ cao nhất trong tổng chi tiêu, hơn 30%. Tuy nhiên, con số này giảm đều trong bốn thập kỷ tiếp theo, chỉ còn khoảng 15% vào năm 2000. Giải trí cũng giảm dần, từ 20% xuống hơn 15%. Tương tự, chi tiêu cho quần áo giảm nhẹ từ 10% xuống dưới mức đó, và năng lượng giảm từ khoảng 6% xuống còn 3%.
Ngược lại, giao thông có xu hướng tăng. Bắt đầu ở mức 10% năm 1960, nó tăng đều trong suốt giai đoạn và vượt qua giải trí cùng thực phẩm vào năm 2000, đạt khoảng 15%.
Tóm lại, trong khi hầu hết các hạng mục đều giảm chi tiêu, giao thông ngày càng trở nên quan trọng, cho thấy sự thay đổi trong ưu tiên của người dân hướng đến di chuyển và du lịch.)
Gợi ý 2:
The line graph compares the proportion of spending on five different items—food, leisure, clothing, transport, and energy—in a European country from 1960 to 2000. It is clear that expenditure on food and energy declined sharply, whereas transport spending increased steadily.
In 1960, food represented the highest percentage of total spending, at slightly above 30%. This figure fell continuously to around 15% by 2000. Leisure also declined from 20% to about 17%, while clothing dropped marginally from 10% to around 8%. Energy spending was the lowest throughout the period, decreasing from 6% to roughly 3%.
By contrast, transport was the only category that showed growth. It started at 10% in 1960 and rose gradually to 15% by 2000, becoming one of the top spending areas by the end of the period.
Overall, the data indicates that people in this European country spent less on basic necessities such as food and energy over time, while transport became a more prominent part of household expenditure.
(Biểu đồ đường so sánh tỷ lệ chi tiêu cho năm hạng mục khác nhau—thực phẩm, giải trí, quần áo, giao thông và năng lượng—ở một quốc gia châu Âu từ năm 1960 đến 2000. Rõ ràng rằng chi tiêu cho thực phẩm và năng lượng giảm mạnh, trong khi chi tiêu cho giao thông tăng đều.
Năm 1960, thực phẩm chiếm tỷ lệ cao nhất trong tổng chi tiêu, hơn 30%. Con số này giảm liên tục xuống khoảng 15% vào năm 2000. Giải trí cũng giảm từ 20% xuống khoảng 17%, trong khi quần áo giảm nhẹ từ 10% xuống khoảng 8%. Năng lượng là hạng mục có tỷ lệ thấp nhất trong suốt giai đoạn, giảm từ 6% xuống khoảng 3%.
Ngược lại, giao thông là hạng mục duy nhất tăng. Bắt đầu ở mức 10% năm 1960, nó tăng dần lên 15% vào năm 2000, trở thành một trong những lĩnh vực chi tiêu hàng đầu vào cuối giai đoạn.
Nhìn chung, dữ liệu cho thấy người dân ở quốc gia này chi tiêu ít hơn cho các nhu cầu cơ bản như thực phẩm và năng lượng theo thời gian, trong khi giao thông trở thành phần quan trọng hơn trong ngân sách hộ gia đình.)