The line graph shows oil production and consumption in China between 1982 and 2006. Summarise the information by selecting and reporting the main features and make comparisons where relevant.
9/49
The line graph shows oil production and consumption in China between 1982 and 2006.
Summarise the information by selecting and reporting the main features and make comparisons where relevant.
Write at least 150 words.
Hướng dẫn giải:
Gợi ý 1:
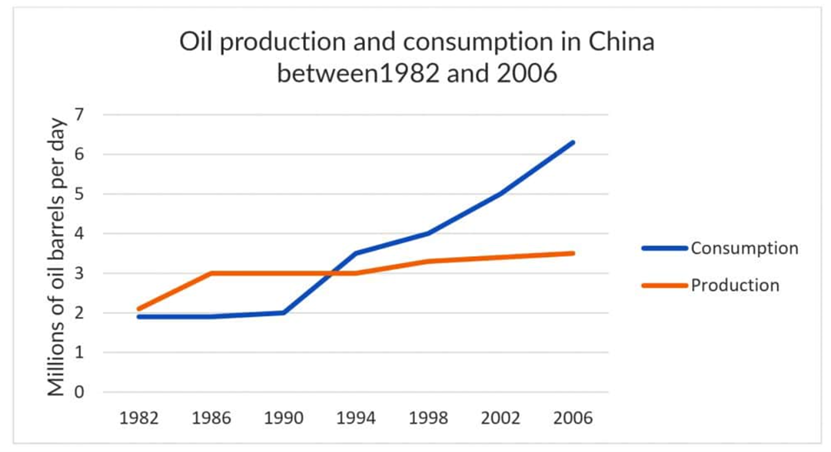
The line graph illustrates oil production and consumption figures in China over a 24-year period from 1982 to 2006, measured in millions of barrels per day. Overall, both metrics experienced an upward trajectory throughout the period. However, while oil production grew at a relatively stable and modest pace, consumption surged dramatically, eventually surpassing production and widening significantly by the end of the timeframe.
In 1982, China’s oil production stood at approximately 2.1 million barrels per day, which was higher than its consumption level of nearly 1.9 million barrels per day. Over the next four years, production experienced a sharp rise, reaching 3 million barrels per day by 1986, where it plateaued until 1994. In contrast, oil consumption remained relatively stagnant at around 1.9 to 2 million barrels per day between 1982 and 1990.
A significant turning point occurred around 1993 and 1994, when consumption lines intersected and overtook production figures at roughly 3.5 million barrels per day. Following this crossover, consumption escalated steeply, climbing from 4 million barrels per day in 1998 to a peak of approximately 6.3 million barrels per day in 2006. Meanwhile, production grew at a much slower rate after 1994, reaching a final plateau of about 3.5 million barrels per day by 2006, creating a substantial deficit between domestic supply and demand.
(Biểu đồ đường minh họa các số liệu về sản lượng và tiêu thụ dầu ở Trung Quốc trong giai đoạn 24 năm từ 1982 đến 2006, được tính bằng triệu thùng mỗi ngày. Nhìn chung, cả hai chỉ số đều trải qua xu hướng tăng lên trong suốt thời kỳ này. Tuy nhiên, trong khi sản lượng dầu tăng trưởng với tốc độ tương đối ổn định và khiêm tốn, mức tiêu thụ lại tăng vọt một cách kịch tính, cuối cùng vượt qua sản lượng và nới rộng đáng kể vào cuối khoảng thời gian. Vào năm 1982, sản lượng dầu của Trung Quốc ở mức khoảng 2,1 triệu thùng/ngày, cao hơn mức tiêu thụ gần 1,9 triệu thùng/ngày. Trong bốn năm tiếp theo, sản lượng đã tăng mạnh, đạt 3 triệu thùng/ngày vào năm 1986 và giữ nguyên mức này cho đến năm 1994. Ngược lại, tiêu thụ dầu vẫn tương đối trì trệ ở mức khoảng 1,9 đến 2 triệu thùng/ngày từ năm 1982 đến 1990. Một bước ngoặt quan trọng xảy ra vào khoảng năm 1993 và 1994, khi đường tiêu thụ cắt ngang và vượt qua các số liệu sản lượng ở mức khoảng 3,5 triệu thùng/ngày. Sau điểm giao cắt này, mức tiêu thụ leo thang dốc đứng, tăng từ 4 triệu thùng/ngày vào năm 1998 lên đỉnh điểm khoảng 6,3 triệu thùng/ngày vào năm 2006. Trong khi đó, sản lượng tăng với tốc độ chậm hơn nhiều sau năm 1994, đạt mức ổn định cuối cùng là khoảng 3,5 triệu thùng/ngày vào năm 2006, tạo ra một sự thiếu hụt đáng kể giữa nguồn cung và nhu cầu trong nước.)
Gợi ý 2:
The provided line graph details the daily quantities of oil produced and consumed in China from 1982 to 2006. A prominent feature of the chart is that China transitioned from being a net exporter (producing more than it consumed) to a major net importer as consumption rapidly outpaced domestic production over the 24-year span.
At the start of the period in 1982, production outstripped consumption, with figures recorded at 2.1 million and 1.9 million barrels per day, respectively. Between 1982 and 1986, production grew significantly to hit 3 million barrels per day, remaining completely flat at this level until 1994. During this same 12-year bracket, consumption changed very little initially, lingering near 2 million barrels per day until 1990 before beginning a steep ascent.
By 1994, consumption matched and then exceeded production at 3.5 million barrels per day. From 1994 onwards, the two indicators diverged sharply. While production experienced a very gradual increase from 3 million to roughly 3.5 million barrels per day between 1994 and 2006, consumption accelerated past 4 million barrels per day in 1998 and continued a relentless climb to reach a high of 6.3 million barrels per day at the end of the period in 2006.
(Biểu đồ đường được cung cấp trình bày chi tiết về số lượng dầu được sản xuất và tiêu thụ hàng ngày ở Trung Quốc từ năm 1982 đến 2006. Một đặc điểm nổi bật của biểu đồ là Trung Quốc đã chuyển đổi từ một quốc gia xuất khẩu ròng (sản xuất nhiều hơn tiêu thụ) thành một quốc gia nhập khẩu ròng lớn khi mức tiêu thụ vượt qua nhanh chóng sản lượng trong nước trong khoảng thời gian 24 năm. Vào thời điểm bắt đầu giai đoạn năm 1982, sản lượng vượt qua mức tiêu thụ, với các số liệu được ghi nhận lần lượt là 2,1 triệu và 1,9 triệu thùng/ngày. Giữa năm 1982 và 1986, sản lượng tăng đáng kể để đạt 3 triệu thùng/ngày, giữ nguyên ở mức này cho đến năm 1994. Trong cùng khoảng thời gian 12 năm này, mức tiêu thụ ban đầu thay đổi rất ít, duy trì gần mức 2 triệu thùng/ngày cho đến năm 1990 trước khi bắt đầu tăng vọt. Đến năm 1994, mức tiêu thụ đã bắt kịp và sau đó vượt qua sản lượng ở mức 3,5 triệu thùng/ngày. Từ năm 1994 trở đi, hai chỉ số này phân kỳ rõ rệt. Trong khi sản lượng trải qua mức tăng rất từ từ từ 3 triệu lên khoảng 3,5 triệu thùng/ngày giữa năm 1994 và 2006, mức tiêu thụ đã tăng tốc vượt qua 4 triệu thùng/ngày vào năm 1998 và tiếp tục leo dốc không ngừng để đạt đỉnh 6,3 triệu thùng/ngày vào cuối giai đoạn năm 2006.)