The chart shows the proportion of renewable energy in the total energy supply in 4 countries from 1997 to 2010. Summarise the information by selecting and reporting the main features, and mak
28/49
The chart shows the proportion of renewable energy in the total energy supply in 4 countries from 1997 to 2010. Summarise the information by selecting and reporting the main features, and make comparisons where relevant.
Hướng dẫn giải:
Gợi ý 1:
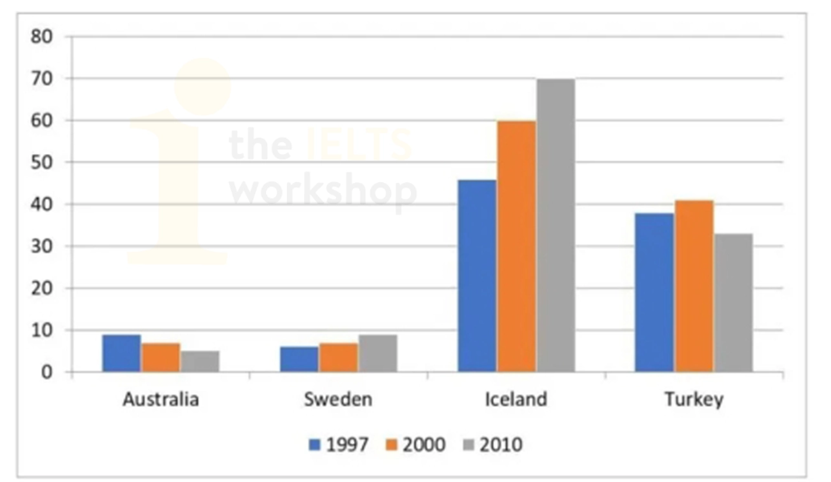
The provided bar chart illustrates the proportion of renewable energy in the total energy supply across four countries—Australia, Sweden, Iceland, and Turkey—in three specific years: 1997, 2000, and 2010.
Overall, Iceland consistently recorded the highest share of renewable energy throughout the period, whereas Australia and Sweden registered the lowest proportions. Additionally, renewable energy adoption experienced divergent trajectories among the nations, with Iceland and Sweden seeing upward trends while Australia and Turkey witnessed downward trends over the thirteen years.
In 1997, Iceland led the chart with approximately 46% of its total energy supply coming from renewable sources, followed closely by Turkey at nearly 38%. Australia accounted for roughly 9%, while Sweden recorded the lowest share at just over 6%.
By 2010, Iceland’s renewable energy proportion surged dramatically to reach a peak of 70%. Sweden also experienced a steady growth, increasing its share to around 9%. In contrast, Turkey saw a slight fluctuation, peaking at over 40% in 2000 before declining to roughly 33% in 2010. Similarly, Australia experienced a continuous downward trend, with its renewable energy supply proportion dropping to approximately 5% by the end of the period.
(Biểu đồ cột được cung cấp minh họa tỷ lệ năng lượng tái tạo trong tổng nguồn cung năng lượng ở bốn quốc gia—Úc, Thụy Điển, Iceland và Thổ Nhĩ Kỳ—vào ba năm cụ thể: 1997, 2000 và 2010. Nhìn chung, Iceland liên tục ghi nhận tỷ trọng năng lượng tái tạo cao nhất trong suốt giai đoạn này, trong khi Úc và Thụy Điển ghi nhận tỷ lệ thấp nhất. Ngoài ra, việc áp dụng năng lượng tái tạo đã trải qua các quỹ đạo khác nhau giữa các quốc gia, với Iceland và Thụy Điển có xu hướng tăng trong khi Úc và Thổ Nhĩ Kỳ chứng kiến xu hướng giảm trong mười ba năm. Vào năm 1997, Iceland dẫn đầu biểu đồ với khoảng 46% tổng nguồn cung năng lượng đến từ các nguồn tái tạo, theo sau là Thổ Nhĩ Kỳ ở mức gần 38%. Úc chiếm khoảng 9%, trong khi Thụy Điển ghi nhận tỷ trọng thấp nhất ở mức hơn 6%. Đến năm 2010, tỷ trọng năng lượng tái tạo của Iceland tăng vọt lên mức đỉnh 70%. Thụy Điển cũng trải qua sự tăng trưởng ổn định, tăng tỷ trọng của mình lên khoảng 9%. Ngược lại, Thổ Nhĩ Kỳ chứng kiến sự biến động nhẹ, đạt đỉnh hơn 40% vào năm 2000 trước khi giảm xuống khoảng 33% vào năm 2010. Tương tự, Úc trải qua xu hướng giảm liên tục, với tỷ trọng nguồn cung năng lượng tái tạo giảm xuống khoảng 5% vào cuối kỳ.)
Gợi ý 2:
The bar chart compares the percentage of renewable energy comprising the total energy supply of Australia, Sweden, Iceland, and Turkey in the years 1997, 2000, and 2010.
A striking feature is the vast disparity among the nations, with Iceland generating the vast majority of its energy renewably, contrasting sharply with Australia and Sweden, which remained below 10% across all observed years.
Iceland and Sweden both displayed rising trends in renewable energy usage. Iceland started at about 46% in 1997, rose significantly to 60% in 2000, and culminated at 70% in 2010, maintaining the top rank throughout. Sweden demonstrated a gradual climb from approximately 6% in 1997 to 7% in 2000, eventually reaching nearly 10% by 2010.
Conversely, Turkey and Australia followed a downward or fluctuating pattern. Turkey began with a high proportion of roughly 38% in 1997, which increased to around 41% in 2000, but subsequently fell to approximately 33% in 2010. Australia started at roughly 9% in 1997 and experienced a continuous decline over the decade, dropping to approximately 7% in 2000 and finishing at a low of around 5% in 2010.
(Biểu đồ cột so sánh phần trăm năng lượng tái tạo bao gồm tổng nguồn cung năng lượng của Úc, Thụy Điển, Iceland và Thổ Nhĩ Kỳ trong các năm 1997, 2000 và 2010. Một đặc điểm nổi bật là sự chênh lệch lớn giữa các quốc gia, với việc Iceland tạo ra phần lớn năng lượng của mình từ nguồn tái tạo, tương phản mạnh mẽ với Úc và Thụy Điển, vốn duy trì dưới 10% trong tất cả các năm được quan sát. Iceland và Thụy Điển đều thể hiện xu hướng tăng trong việc sử dụng năng lượng tái tạo. Iceland bắt đầu ở mức khoảng 46% vào năm 1997, tăng đáng kể lên 60% vào năm 2000 và đạt đỉnh ở mức 70% vào năm 2010, duy trì vị trí dẫn đầu trong suốt thời gian qua. Thụy Điển cho thấy sự leo dốc dần từ khoảng 6% vào năm 1997 lên 7% vào năm 2000, cuối cùng đạt gần 10% vào năm 2010. Ngược lại, Thổ Nhĩ Kỳ và Úc tuân theo mô hình giảm hoặc dao động. Thổ Nhĩ Kỳ bắt đầu với tỷ trọng cao khoảng 38% vào năm 1997, tăng lên khoảng 41% vào năm 2000, nhưng sau đó giảm xuống khoảng 33% vào năm 2010. Úc bắt đầu ở mức khoảng 9% vào năm 1997 và trải qua sự suy giảm liên tục trong suốt thập kỷ, giảm xuống khoảng 7% vào năm 2000 và kết thúc ở mức thấp khoảng 5% vào năm 2010.)