The bar charts illustrate the average house expenses in England and its capital city – London, and to present the comparison regarding the average house prices between distinct areas of Engla
12/26
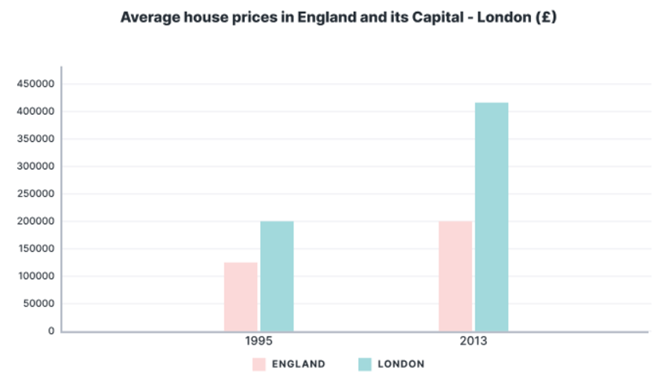
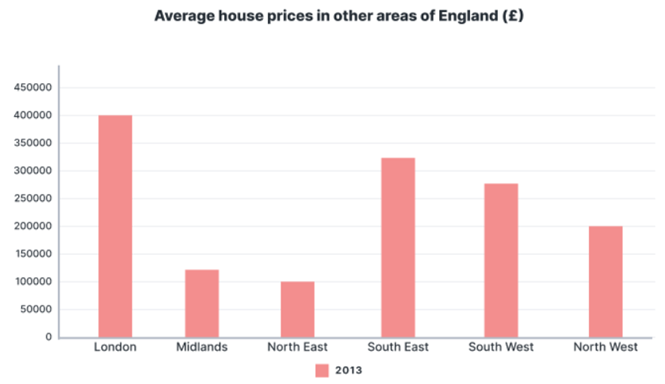
The bar charts illustrate the average house expenses in England and its capital city – London, and to present the comparison regarding the average house prices between distinct areas of England within the year 2013.
Hướng dẫn giải:
Gợi ý 1:
The bar charts illustrate the average house prices in England and its capital city, London, in 1995 and 2013, as well as the average prices in different regions of England in 2013. Overall, house prices increased significantly over the period, with London remaining the most expensive area.
In 1995, the average house price in England was around £125,000, while in London it was higher, at approximately £200,000. By 2013, both figures had risen considerably. The average price in England doubled to £200,000, whereas in London it more than doubled, reaching about £425,000. This indicates that the growth rate in London was much faster than the national average.
The second chart shows the variation in house prices across different regions of England in 2013. London had the highest average price, at roughly £400,000, followed by the South East (£320,000) and the South West (£280,000). In contrast, the North East had the lowest average price, at only £100,000, while the Midlands and North West were moderately priced at £120,000 and £200,000 respectively.
In summary, house prices rose sharply between 1995 and 2013, especially in London, which remained far more expensive than other regions of England.
(Các biểu đồ cột minh họa giá nhà trung bình ở Anh và thủ đô London vào năm 1995 và 2013, cũng như giá trung bình ở các vùng khác của Anh trong năm 2013. Nhìn chung, giá nhà tăng mạnh trong giai đoạn này, với London vẫn là khu vực đắt đỏ nhất.
Năm 1995, giá nhà trung bình ở Anh khoảng £125,000, trong khi ở London cao hơn, khoảng £200,000. Đến năm 2013, cả hai con số đều tăng đáng kể. Giá trung bình ở Anh tăng gấp đôi lên £200,000, còn ở London tăng hơn gấp đôi, đạt khoảng £425,000. Điều này cho thấy tốc độ tăng giá ở London nhanh hơn nhiều so với mức trung bình toàn quốc.
Biểu đồ thứ hai thể hiện sự khác biệt về giá nhà giữa các vùng của Anh năm 2013. London có giá trung bình cao nhất, khoảng £400,000, tiếp theo là vùng Đông Nam (£320,000) và Tây Nam (£280,000). Ngược lại, vùng Đông Bắc có giá thấp nhất, chỉ £100,000, trong khi vùng Midlands và Tây Bắc có giá trung bình lần lượt là £120,000 và £200,000.
Tóm lại, giá nhà tăng mạnh từ năm 1995 đến 2013, đặc biệt ở London, nơi vẫn đắt hơn nhiều so với các vùng khác của Anh.)
Gợi ý 2:
The two bar charts compare average house prices in England and London in 1995 and 2013, and show the average prices in various regions of England in 2013. It is clear that house prices increased dramatically over time, with London being the most expensive area by a large margin.
In 1995, houses in England cost around £125,000 on average, while those in London were priced at about £200,000. By 2013, the figures had risen to £200,000 and £425,000 respectively. This means that London’s house prices more than doubled, whereas the national average increased by roughly 60%.
The second chart reveals regional differences in 2013. London had the highest average house price, at £400,000, followed by the South East (£320,000) and the South West (£280,000). The North East was the cheapest region, with houses costing only £100,000 on average. The Midlands and North West were also relatively affordable, with prices of £120,000 and £200,000 respectively.
Overall, house prices in England rose substantially between 1995 and 2013, and London continued to dominate as the most expensive housing market in the country.
(Hai biểu đồ cột so sánh giá nhà trung bình ở Anh và London vào năm 1995 và 2013, đồng thời thể hiện giá trung bình ở các vùng khác của Anh năm 2013. Rõ ràng rằng giá nhà tăng mạnh theo thời gian, với London là khu vực đắt đỏ nhất.
Năm 1995, giá nhà trung bình ở Anh khoảng £125,000, trong khi ở London là £200,000. Đến năm 2013, các con số tăng lên £200,000 và £425,000 tương ứng. Điều này có nghĩa là giá nhà ở London tăng hơn gấp đôi, trong khi mức trung bình toàn quốc tăng khoảng 60%.
Biểu đồ thứ hai cho thấy sự khác biệt giữa các vùng năm 2013. London có giá nhà trung bình cao nhất, £400,000, tiếp theo là vùng Đông Nam (£320,000) và Tây Nam (£280,000). Vùng Đông Bắc là nơi rẻ nhất, với giá trung bình chỉ £100,000. Midlands và Tây Bắc cũng tương đối rẻ, với giá lần lượt là £120,000 và £200,000.
Nhìn chung, giá nhà ở Anh tăng đáng kể từ năm 1995 đến 2013, và London vẫn là thị trường nhà ở đắt đỏ nhất cả nước.)